Prescriptive Companion — Sector & Policy Recommendations

India Trade — Sector & Policy Recommendations

Every chart and dataset in this repo, served directly via GitHub Pages. Companion repo: India Trade & Macro Data Analysis (the descriptive half).

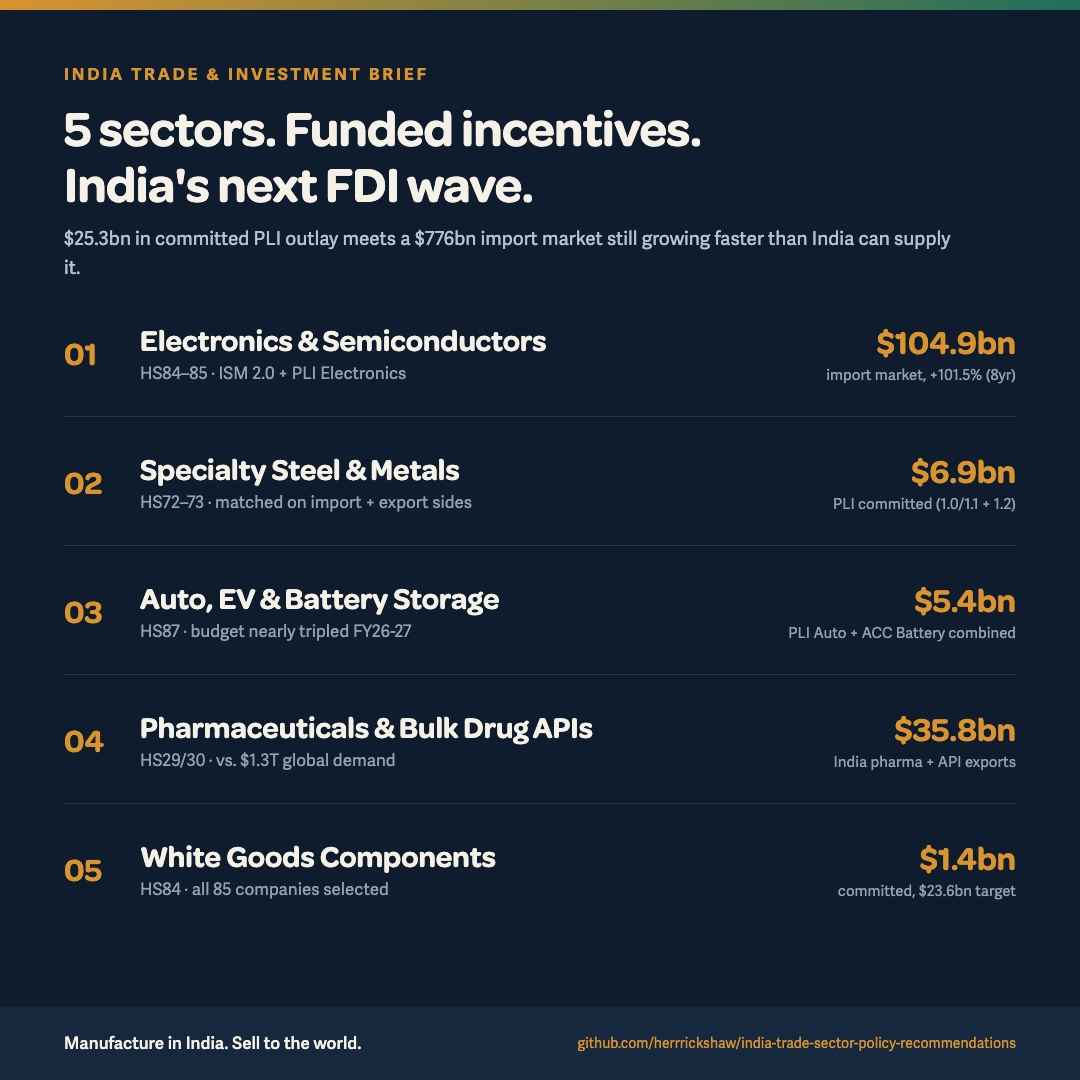
Start here → Sector & Policy Recommendations Download FDI pitch deck (PPTX) Download FDI pitch deck (PDF) View FDI pitch deck (HTML source) View 5-sector social post (PNG) Open repo-verification notebook in Colab
Abstract: why import substitution — the forex position, the plan & the ethanol precedent
The opening frame for the whole program, told in eight narrative acts (arXiv:2406.00554 plan-then-write model): the $333bn deficit as the stakes, PLI as the plan, PIB-verified ethanol blending (₹1.97 lakh cr forex saved) as the precedent — then this repo's own conflict, twist and turning point.
Sector & Policy Recommendations
The capstone: tiered import-substitution / export-growth / country-relationship priorities, a CBAM export-risk flag ($20.7bn), a declining-export-sector flag, and an explicit RCA/TII methodology-gap note.
Beyond PLI: state incentives and emergent state hubs
State-level incentive policies layered on top of central PLI, and which states are emerging as real manufacturing hubs, sector by sector — with sourced evidence, not an unsourced list.
Top 10 FDI sectors: country strategies, game theory & the official tariff timeline
Extends the 5-sector FDI framework to 10 with sourced target countries per sector, a Generalized Nash Equilibrium tariff-rate-quota frame applied to India's own AC-compressor import quota, and a dated timeline of official (non-speculative) 2025-2026 tariff actions.
Maharashtra's FDI: stock-market money, or money in the ground?
Tests whether a third of India's FDI landing in Maharashtra is portfolio money or real projects. Portfolio flows are definitionally excluded (RBI's 10% rule) — the real distortion is that DPIIT attributes inflow to the recipient company's registered office, not the project site, and publishes no caveat saying so. Includes the finding that FDI equity counts pure share purchases, with no greenfield/brownfield split published anywhere.
Did the money actually show up? FDI equity inflow vs. PLI scheme launch dates
Tests real DPIIT/RBI FDI equity inflow against each PLI scheme's launch date, cross-checked against IBEF's FDI benchmark page. Mixed result, plus a proven registered-office data-quality problem in India's own state-wise FDI statistics.
Master sector scorecard: trade partners, policy levers, FDI status & traffic light
Every bulletin in this repo condensed into one table across the 10 priority sectors, with a growing / needs-incentives / lagging traffic light and the reasoning stated for every row.
The case for domestic capital in some states, FDI in others
Benchmarks India's two-tier cost of capital (RBI repo, bank MCLR/EBLR, AAA bonds) against 9 target countries' policy rates, cross-checked against ICRA sector-risk notes — including a caught-and-retracted research fabrication, documented rather than hidden.
Policy & investment insight dashboard
Direct ministry-website verification of all 14 PLI schemes' utilization, incentives, and application status — plus an honest test of whether DPIIT's IEM data or MoSPI's mega-project monitoring can track private investment by state (they can't).
FY2025-26 verdict re-run — Power BI-style trade impact dashboard
All 10 verdicts re-run on FY2025-26 FDI (both former greens fell; Pharma took the green slot), with growth-vs-volume trade analysis and six action items to further reduce the trade deficit.
PLI report card: incentive disbursal, IEM record & companies in production
Letter-grades the government's own incentive payouts (₹28,748cr = ~15% of outlay; Pharma A to ACC Battery F), the IEM approval record, and PIB-credited producing companies per scheme — every claim with its PRID.
State-wise investment implementation — domestic + foreign combined (IEM Part B)
Ranks states on implemented industrial investment 2021-2025 (top 3 = 63.3%), quantifies the IEM-vs-FDI divergence per state (Odisha #2 with 0.14% of FDI), and identifies sector leaders — Metallurgical #1, Chemicals #2 with no PLI at all.
Project workflow & data-sourcing schema
The repo's architecture documented: the seven-gate investment-lifecycle measurement schema (with each source's blind spot), the 14-source data inventory with access methods, and the seven-step working method.
The investor workflow — from sector to sanction via NSWS
Eight steps from "which schemes apply" to incentive claims: NSWS spine (KYA → single window → gateways), per-scheme portals and PMA contacts, the seven statutory gates, calibrated claim expectations, and the dated triggers on the calendar.
Ministry incentive catalog — every company-facing policy, site-verified
Six agents swept 16 ministries' sites, CMS APIs and portals + NSWS: ~100 policies with live application windows, verified closures, and per-ministry site health — including the headless-CMS discovery and the dead-domain findings.
Scheme registry — launch dates, windows, applicants & closures
Every tracked scheme's launch (with Cabinet PRID), incentive window, officially-reported applicant counts, and the closure record: LSEM tenure closed → MPMS, Drones expired with no successor, ACC stalled with a vanished awardee, Steel's 14-of-58 withdrawal.
The investor map — global company pools per incentivized sector
19,795 companies across 107 countries mapped coverage-first to the 12 incentivized sectors: global pool → India's pool → the incentive lane per sector, plus PRID-verified foreign-investor ↔ initiative pairings. Full catalog in the companion repo.
The decade report card — 2014–2026 graded, open windows, who to approach
The one-page synthesis: twelve years of policy graded on outcomes (A = demand-side guarantee designs, F = ACC's zero), portal-verified open windows with deadlines, and ministries ranked for investors in three tiers.
The matured cohort — 18 schemes whose returns are already in
Launch-to-outcome traces inside the 122k-release PIB register: 8 closed-success / 8 partial / 2 laggards — every success ran on a demand-side guarantee or procurement design; the honest instrument-to-loop timescale is ~8–10 years.
Five years of incentive launches (2021–2026) — the migration away from production-linked design
93 Cabinet-register launches classified by five parallel agents over the 83,734-release PIB index: new PLI schemes 11 → 1 → 1 → 0 → 2 → 0; even at the 2021 peak production-linked was 11.2% of new money; payouts migrated output → design → employment (ELI ₹99,446cr).
Beyond PLI — the 2026 non-PLI incentive wave
Full sweep of the 2026 Cabinet register from the repo's PIB index: ~₹1.9 lakh cr of new commitments that de-risk inputs instead of paying for output — and three of the four flagged import gaps (fuels, fertilisers, cotton, pulses) got instruments this year. Plastics & chemicals remain uncovered.
Quarterly refresh blueprint — TOGAF layers × the modern data stack
The operating architecture behind the quarterly refresh: 14-source ingestion, immutable dated snapshots, per-gate change-data-capture deltas (not full re-scans), a Lambda speed layer for mid-quarter events, the seven-step regeneration pipeline, and the failure-mode runbook.
The clearance pipeline — PARIVESH EC data as the IEM A→B leading indicator
Full national EC register via PARIVESH's open API (113,804 proposals): state pipeline depth, sector loading, flagship-project clearance status — including two negative findings (POSCO-JSW JV and RRPCL absent entirely).
Are import-dependent sectors getting government attention?
12-chapter import ranking vs. a six-month roundup of PIB-reported government schemes.
Where India's forex actually goes — country by country
FY2025-26 bilateral trade balance by partner country, with a decade of policy history behind the five biggest deficits.
Priority trade partners by import-growth sector, and real PLI coverage
12 fastest-growing import chapters mapped to top supplier countries, cross-sector country-priority ranking, and PLI coverage check.
Priority export destinations by growth sector, and the export side of PLI
The export-side mirror: 12 growth export chapters mapped to top destination countries and PLI coverage.